Friday, 17 February 2017
Thursday, 16 February 2017
Session 6: Plotting addresses on Google Maps using R and R Google Maps
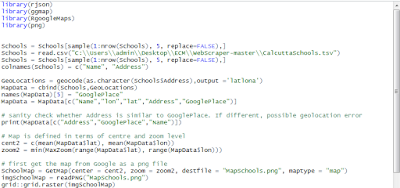
Plotting Addresses on Google Maps using R and R GoogleMaps
In an earlier post, we had shown how locations as defined by addresses could be plotted on Google Maps but the process was rather complicated. First, the geocoding had to be done separately and secondly a lot of messy Javascript had to be coded by hand. Finally the map that was produced could only be viewed with an internet connection.


Wednesday, 1 February 2017
Session 6 :Visualization : Using R for Maps of India - state, district, taluka level maps
Using R for Maps of India - state, district, taluka level maps
Displaying spatial data on maps is always interesting but most Visualisation tools do not offer facilities to create maps of India, especially at the state and lower levels. In this post, we will show how such maps can be made.The base data for such maps, the "polygons" that define the country, the states, the districts and even the talukas ( or sub-divisions) is available from an organisation called Global Administrative Areas or gadm.org. Country level files for almost all countries are available in a variety of formats including R and these are at three different levels. For India, these files can be downloaded as IND_admN.RData where N = 1,2,3. These will form the raw data from which we will create our maps.
Subscribe to:
Comments (Atom)


